


Dry Channel of Loire River 2022


https://www.newsweek.com/trump-fire-and-fury-smart-genius-obama-774169

 .
.
.
.
.

.
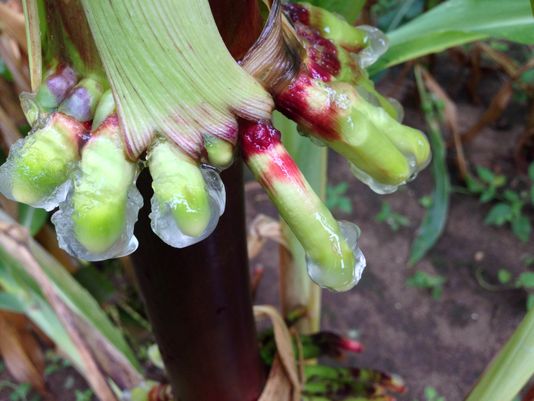
Photo: Courtesy of Jean-Michel Ané
.
.


")


![]()


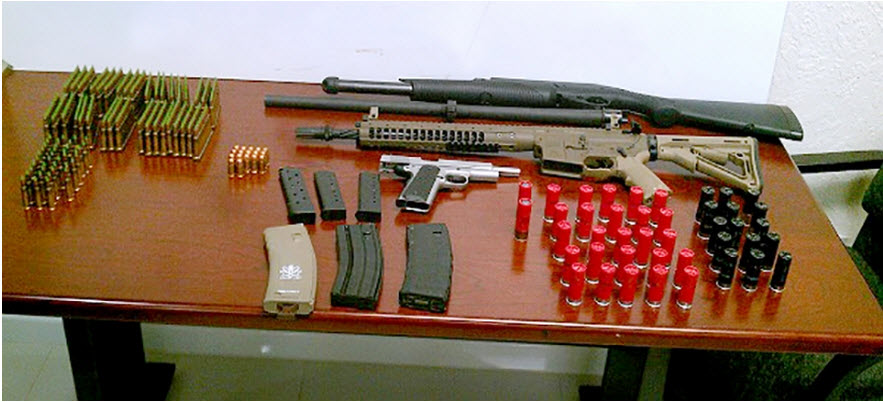
300,000 Strong NFOP


![]()
![]()


…

…


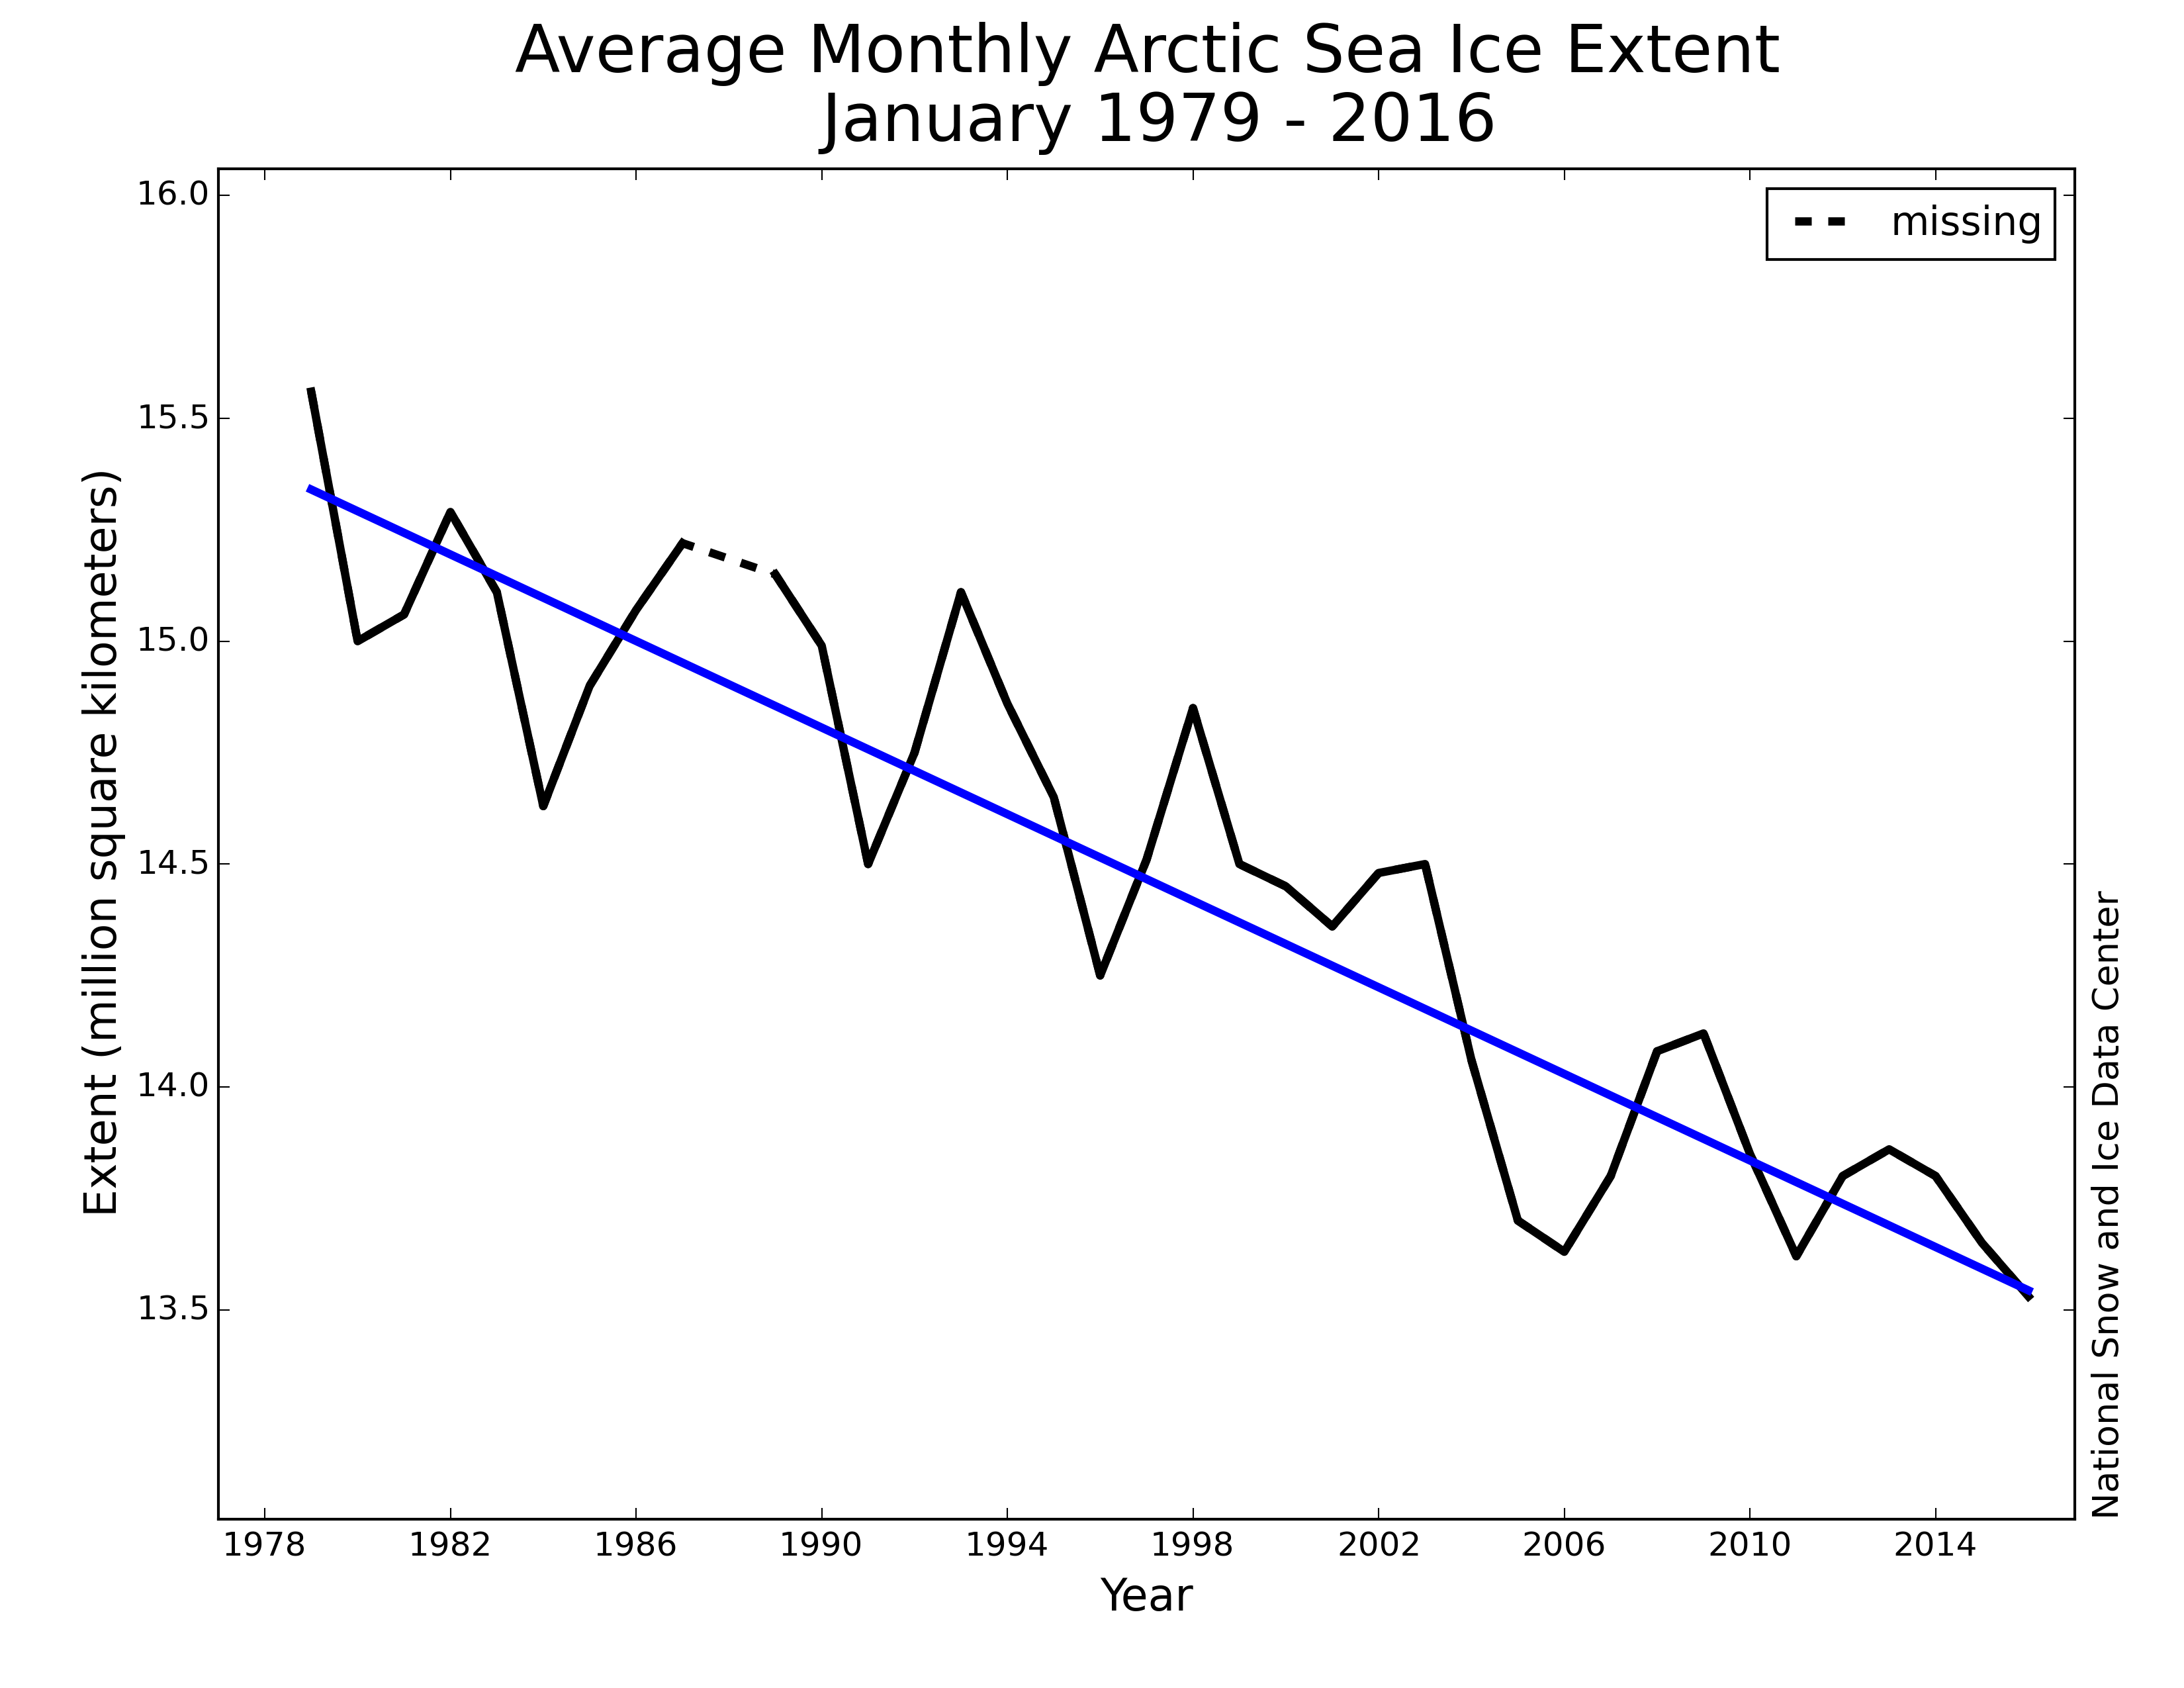
Figure 3. Monthly January ice extent for 1979 to 2016 shows a decline of 3.2% per decade.Credit: National Snow and Ice Data Center
High-resolution image
Image 4 of 5 (play slideshow) Download
![]()


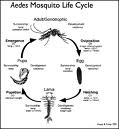
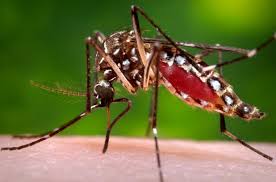
Aedes Family Tree


![]()

![]()


 .. .
.. . 
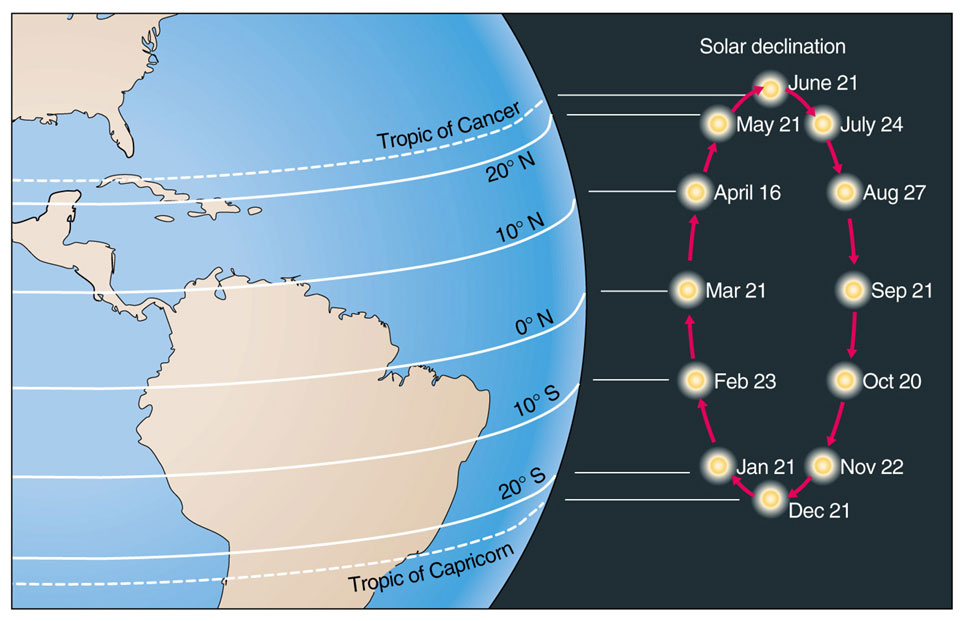
Effects of Latitude on Sun Position in the Sky


![]()


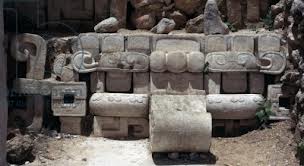
 Various works by Michel Maugée:
 ")


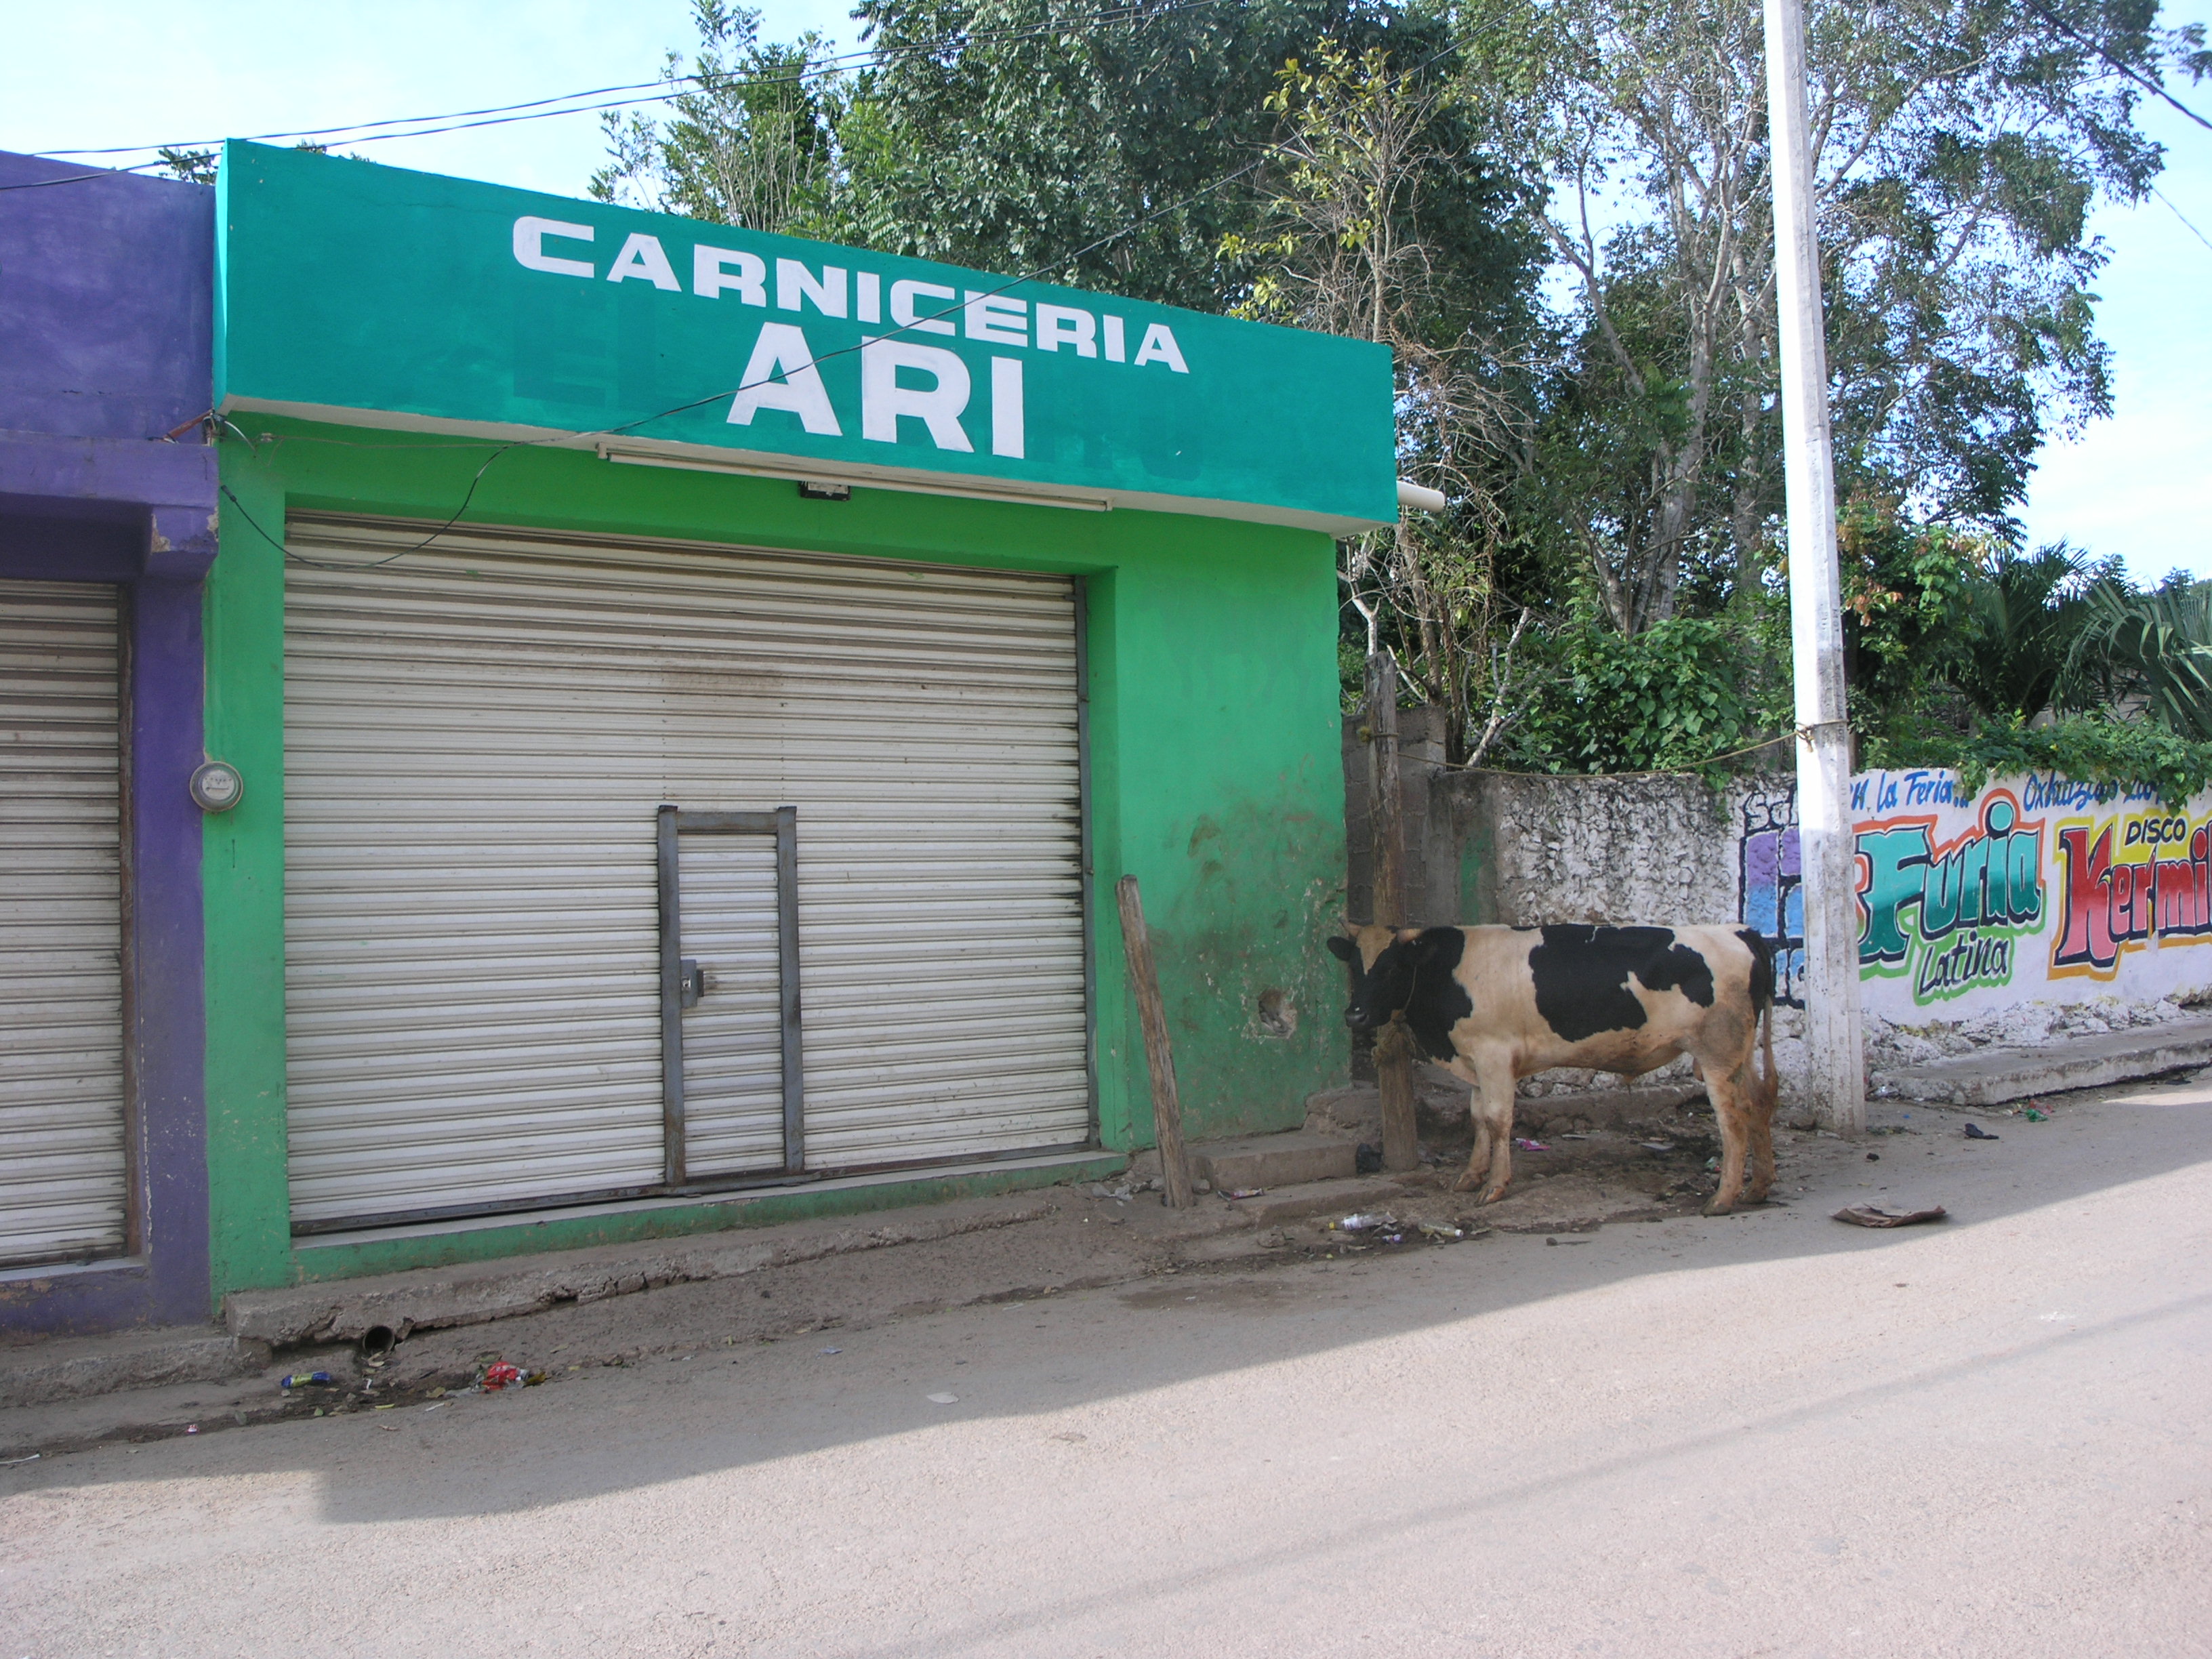
 Figure 1. Percentage of human, retail meat, and food-animal samples positive for Salmonella spp. detected by an integrated food chain system in Mexico, 2002–2005. Numbers to the right of bars indicate average values, and numbers in parentheses indicate the frequency of positive samples in the states with the lowest and highest prevalence, respectively. The number of specimens examined from each source (n) is shown next to each source heading. http://wwwnc.cdc.gov/eid/article/14/3/07-1057-f1.htm


Did I happen to mention that Michel Maugée is a little bit eccentric?